Segregation and School Funding: How Housing Discrimination Reproduces Unequal Opportunity
Executive Summary
It is difficult to overstate the importance of segregation for race- and ethnicity-based school funding disparities in the United States. In many respects, unequal educational opportunity depends existentially on segregation.
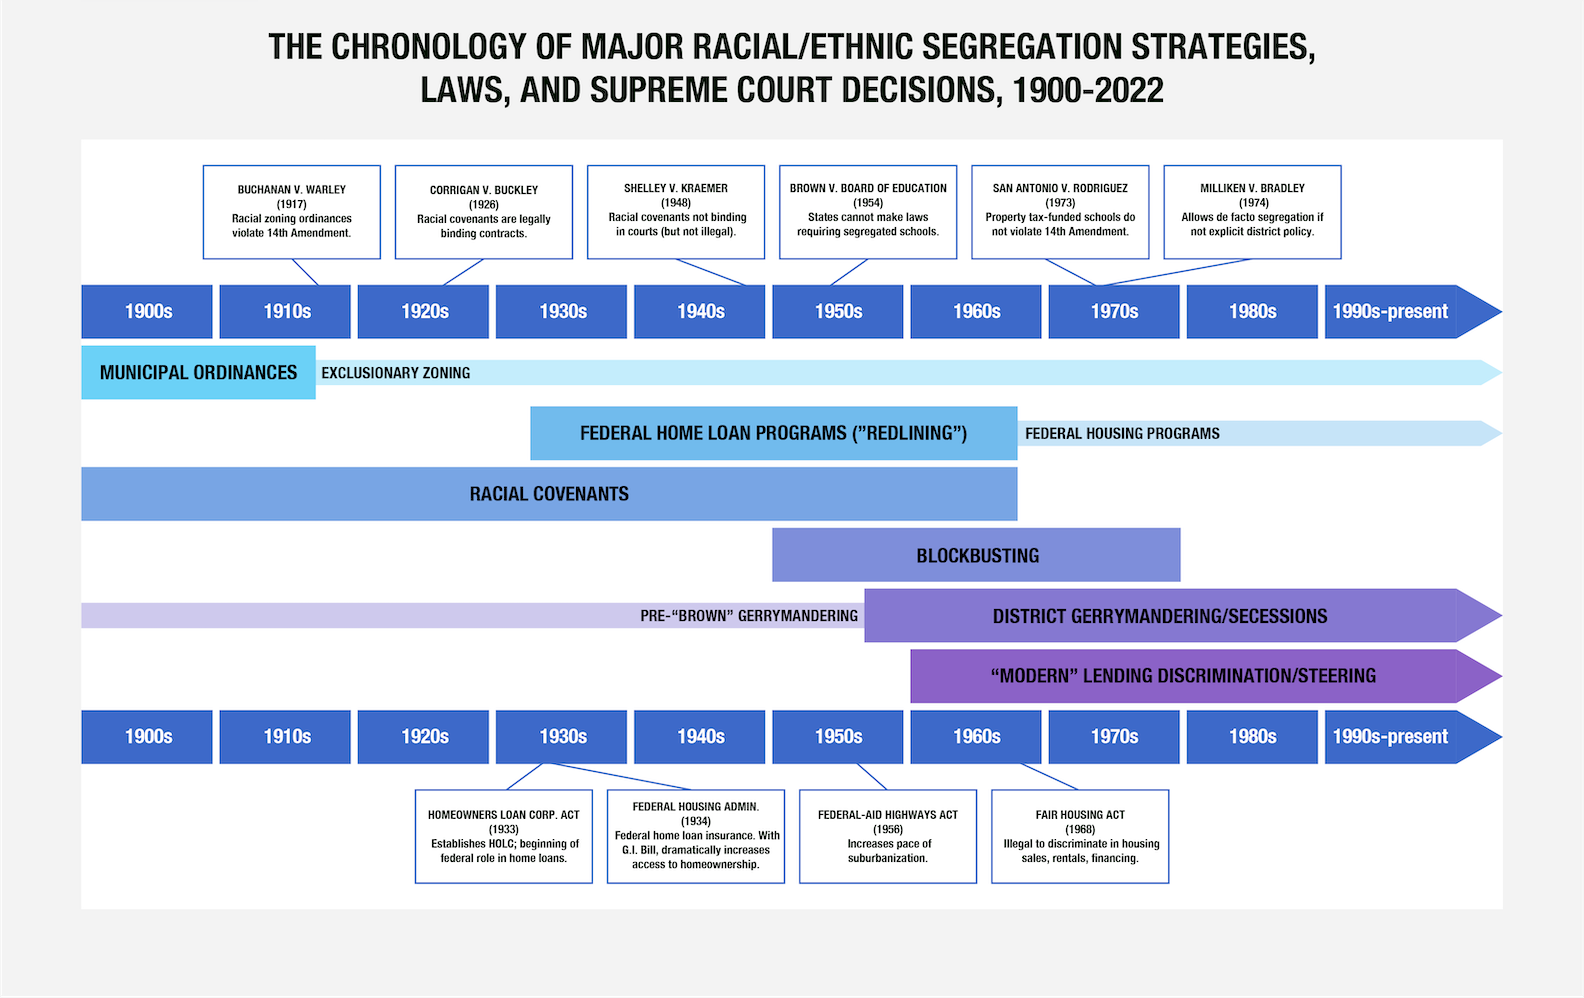
Yet racial and ethnic segregation—and thus its impact on school funding—is most certainly not a recent phenomenon. Throughout most of the 20th century, white people decided where other races were allowed to live. An evolving array of strategies, from municipal laws to private contracts to federal aid programs, established and reinforced the systematic separation of households by race and ethnicity in the nation’s burgeoning metropolitan areas. And they have been incredibly effective.
These efforts, several of which persist today, laid the foundation for the modern segregation regime in the United States. Nonwhite families were confined to urban centers or isolated “inner ring” suburbs, while white families dispersed into all-white outer suburbs (that were often established as autonomous entities with their own school systems). The central purpose was to segregate people based on race, but this inevitably segregated resources as well. Even if nonwhite families overcame the discriminatory barriers to buying a home, the neighborhoods in which they were allowed to live—due precisely to their being allowed to live there—were artificially assessed as lower value and higher risk than white areas. Racial and ethnic disparities in wealth accumulation were therefore perpetuated over generations, ensuring persistent segregation even after explicitly racist housing discrimination was outlawed.
This process has had serious and lasting implications for many important outcomes, including modern school funding equity. In the United States, school districts rely heavily on local property tax revenue, which means where one lives—particularly in which district—in no small part determines how well one’s neighborhood’s schools are funded. The mutually dependent relationship between economic and racial/ethnic segregation simultaneously depresses revenue and increases costs in racially isolated districts, creating a self-sustaining cycle of unequal opportunity and unequal outcomes.
The descriptive analysis presented in this report examines this process, both nationally and with a focus on seven metropolitan areas: Baltimore (Maryland), the Bay Area (California), Birmingham (Alabama), Hartford (Connecticut), Kansas City (Kansas/Missouri), San Antonio (Texas), and the Twin Cities (Minnesota/Wisconsin).
Summary of Results (click on the graphs and maps to enlarge)
We unpack the segregation/school funding relationship in stages. After a review of the major institutional “tools” used to segregate U.S. metropolitan areas throughout the 20th century, we show that—thanks in no small part to the ongoing legacy of generations of segregation—Black and Hispanic homeowners in all seven metro areas have less income, have lower housing values, and pay higher effective property tax rates than do their white counterparts.1
These “first order” effects of segregation on wealth and income inevitably play out in “second order” effects on local property tax revenue for K-12 schools. Most notably, within most of our metro areas, the typical Black or Hispanic student’s district receives less local property tax revenue than does the typical white student’s district.
State general aid in most areas closes at least part of the gaps, but, in any case, these resource disparities must be evaluated with an eye on a “third order” effect of segregation on funding: The concentration of poverty in racially isolated areas not only depresses revenue, but also increases educational costs. That is, districts serving larger shares of high-needs students must invest more to achieve the same outcomes. This creates (and sustains) unequal educational opportunity—i.e., large gaps in the adequacy of school funding between students of different races and ethnicities living in the same metro area.
We measure these opportunity gaps using a national cost model that estimates the per-pupil funding levels required (i.e., adequate) to achieve the “benchmark” common goal of national average math and reading scores for over 12,000 public school districts; these adequate spending levels are compared with actual spending in each district (and metro area).
At the aggregate level, we find substantial racial/ ethnic educational opportunity gaps within all of our “case study” metro areas. To give a rough sense of the magnitudes, if our data are pooled across all seven areas, spending for the typical white student is about $3,000 per pupil above estimated adequate levels, whereas spending is roughly $3,000 below adequate for the average Black student and just over $2,000 below adequate for the typical Hispanic student.
Such race-/ethnicity-based adequacy gaps across entire metro areas, however, are a symptom of the segregation of students between districts within those metro areas. In other words, the typical Black or Hispanic student’s district is less adequately funded than the typical white student’s because these groups are concentrated in certain districts. Accordingly, nationally, we find that metro areas with greater between-district segregation tend to have larger adequate funding gaps between white and Black/Hispanic students. In general, where opportunity is most unequal, segregation is extensive.
This relationship is no less clear at the district level. In both our seven case study metro areas as well as nationally, we find that districts serving majority-Black/Hispanic student populations are overwhelmingly likely to be funded inadequately (and to have relatively poor student outcomes to match).
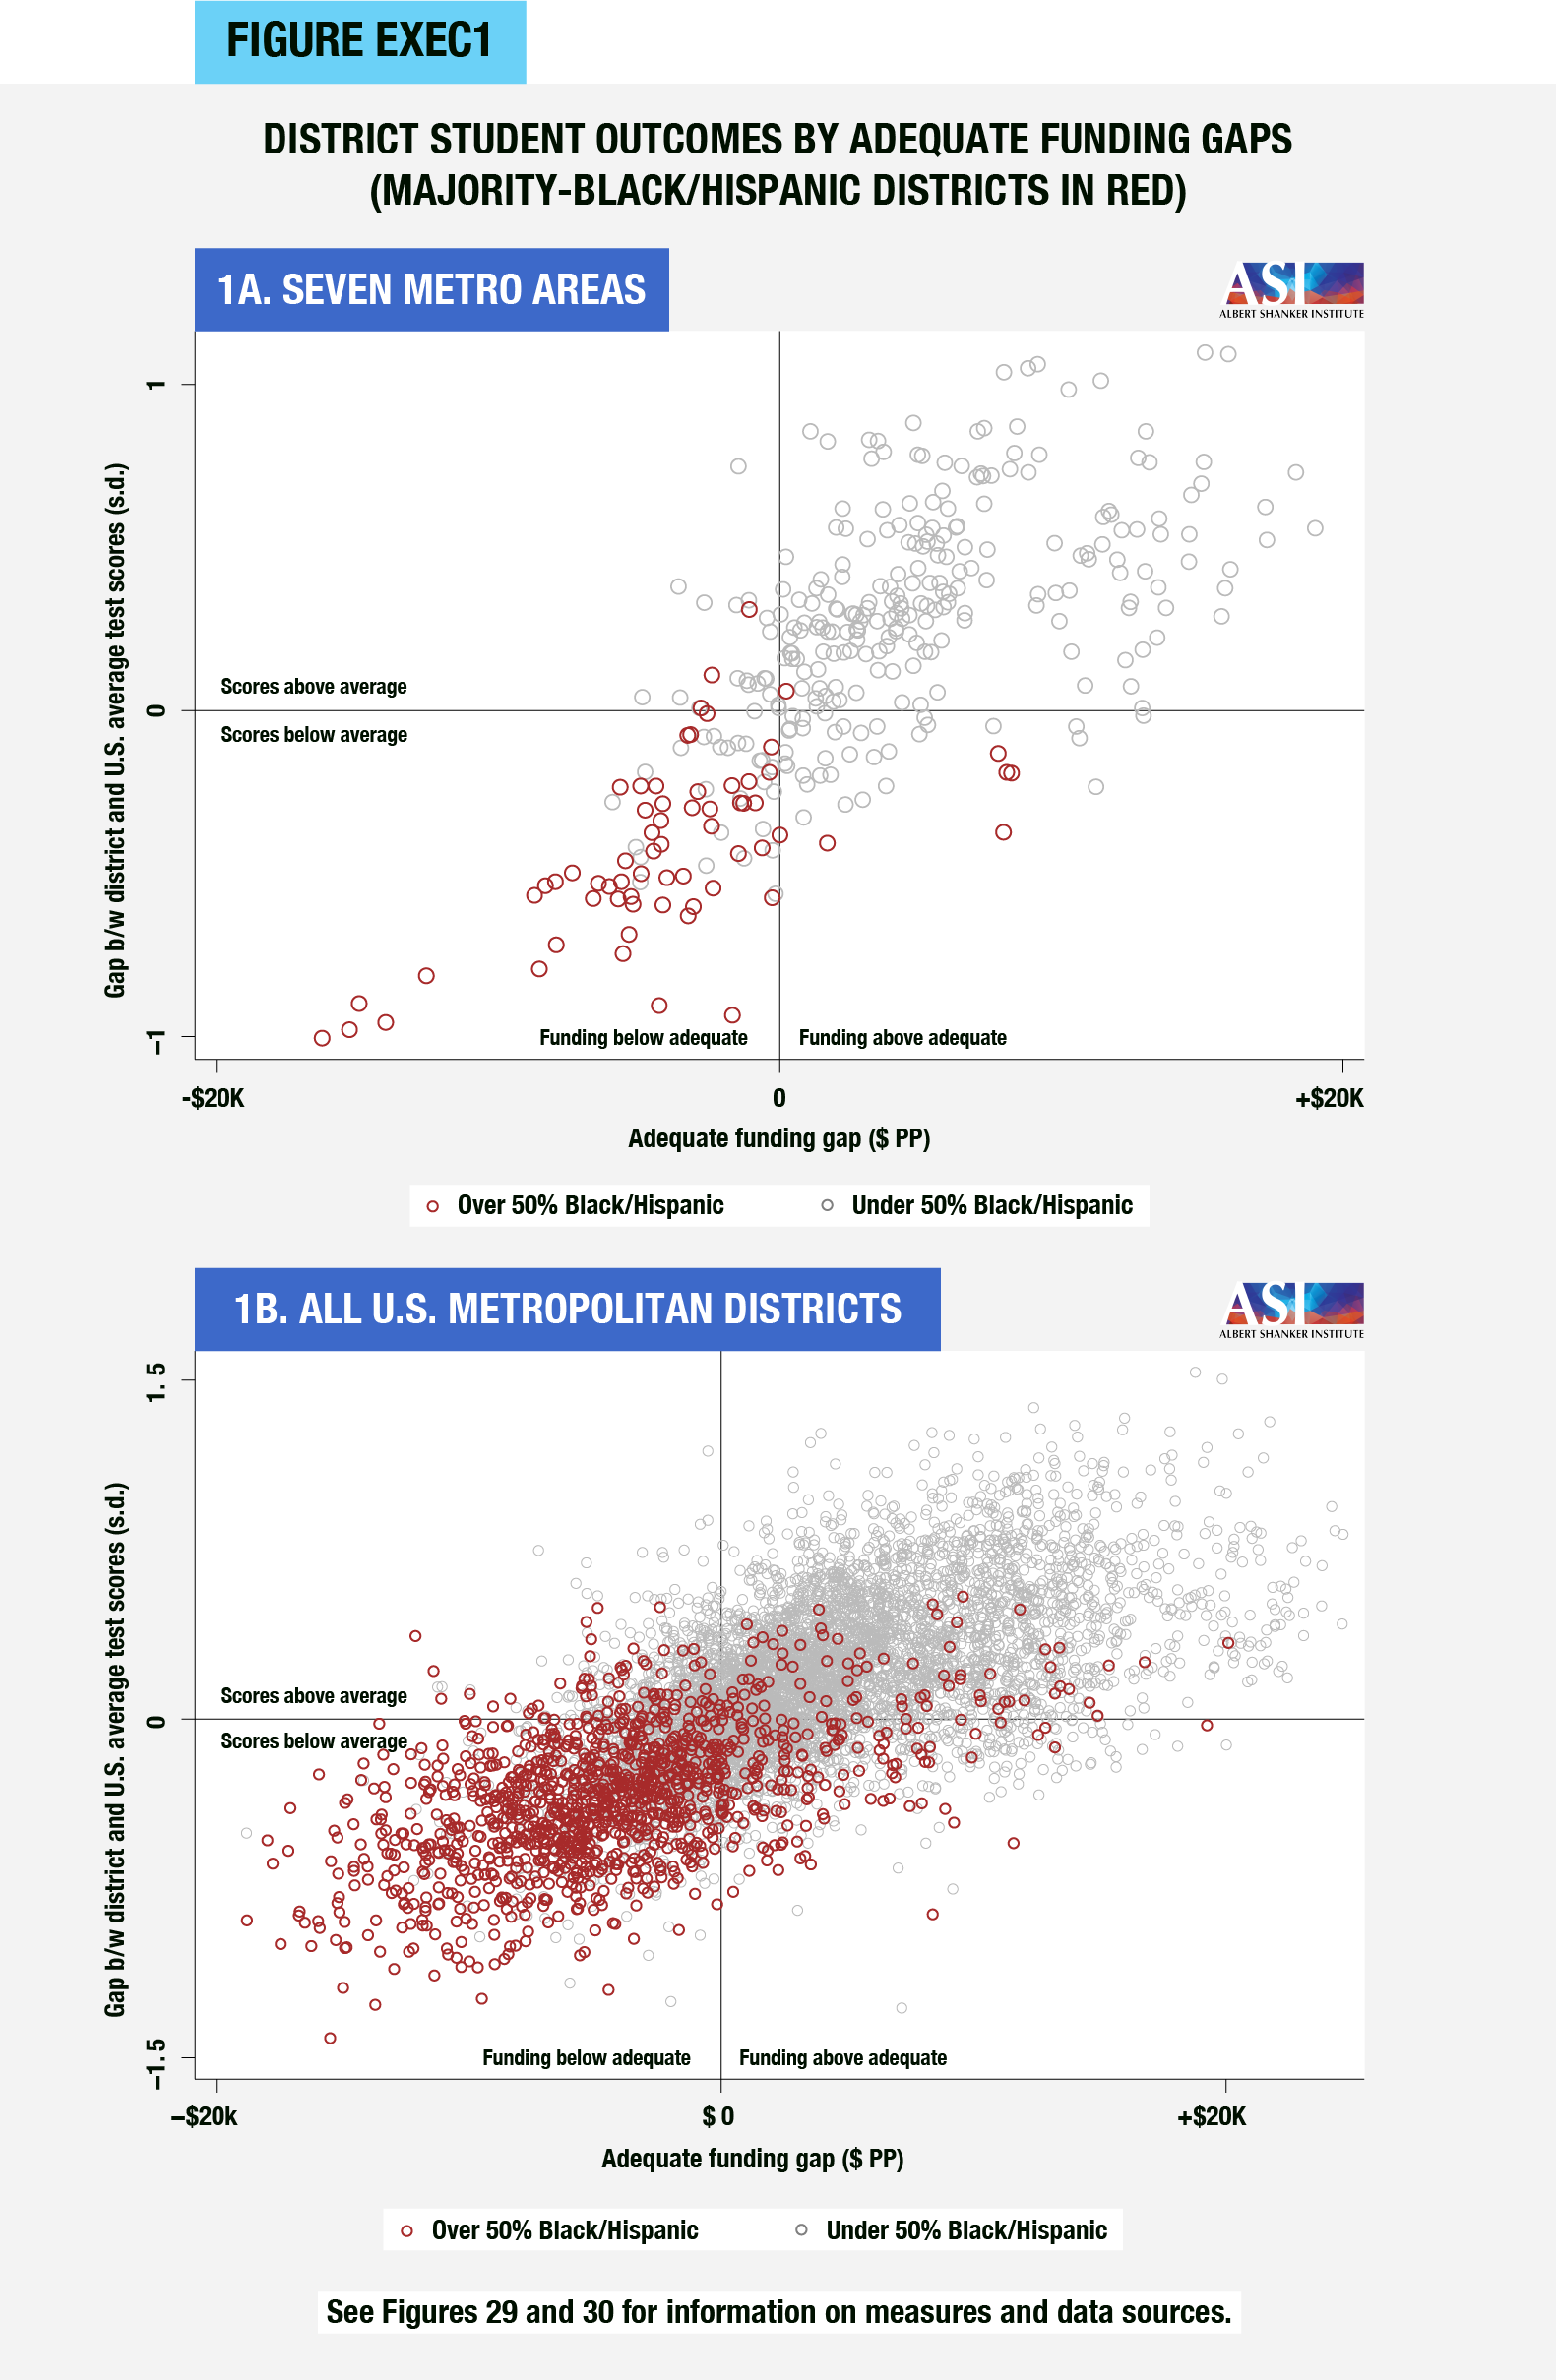
- Across all seven metro areas, 90 percent of majority-Black/Hispanic districts spend below estimated adequate levels, compared with 12 percent of majority-white districts.
- And this matters for student outcomes: 85 percent of majority-Black/Hispanic districts are both inadequately funded and score below the U.S. average on math and reading tests, compared with 6 percent of majority-white districts. (See Figure Exec1A.)
- Conversely, out of the roughly 200 districts throughout all seven metro areas with funding above adequate levels and testing outcomes above the U.S. average, precisely one serves a majority-Black/Hispanic student population.
- The same basic conclusions apply nationally: For instance, of the over 1,300 majority-Black/ Hispanic regular public school districts located in U.S. metropolitan areas, roughly 82 percent receive inadequate funding, compared with about 22 percent of majority-white districts. Among the roughly 3,200 metropolitan districts in which funding is adequate and scores are above the U.S. average, only 80 (2 percent) are majority Black/Hispanic. (See Figure Exec1B.)
In order to address the fact that the “majority-Black/ Hispanic” threshold depends in part on metro area racial/ethnic composition (e.g., in metro areas with smaller Black/Hispanic populations, students may be segregated even if districts don’t reach the majority threshold), as well as the fact that some states’ finance systems are less generous than others, we also examine the association between districts’ racial/ethnic composition and funding adequacy with both outcomes defined relative to each district’s metro area overall. For example, we measure racial/ ethnic composition as the difference (in percentage points) between each district’s percentage of Black/ Hispanic students and its overall metro area’s percentage of Black/Hispanic students.
And we again find a very strong relationship: Districts that serve disproportionately large shares of their metro areas’ Black and Hispanic students also have less adequate funding compared with their metro areas overall.
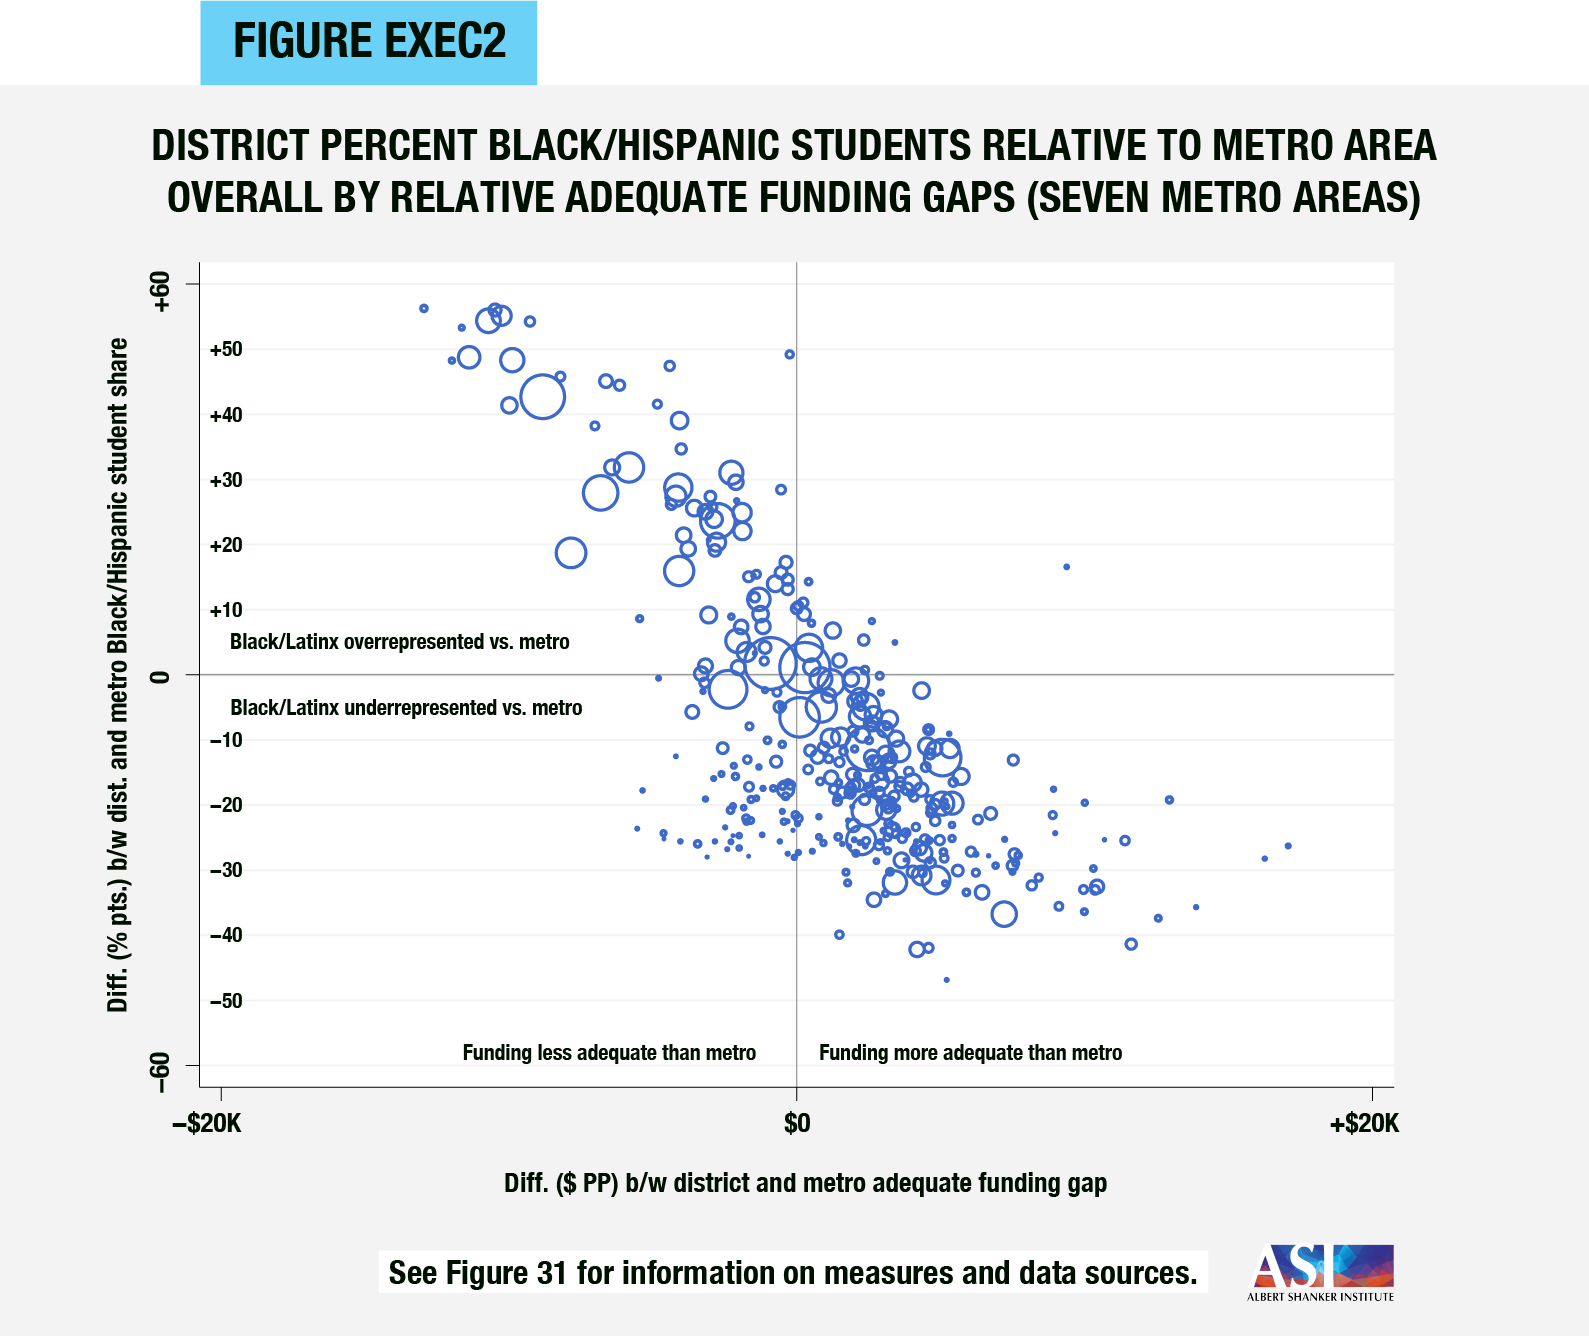
- For example, across our seven metro areas, there are 41 districts in which the percent of Black/ Hispanic students is at least 20 percentage points higher than their metro areas overall. Every single one is funded less adequately than its metro area. (See Figure Exec2.)
- Similarly, among the 60 districts in which the Black/Hispanic share is at least 10 percentage points higher, 55 (92 percent) are funded less adequately than their metro areas.
- And this too holds across all U.S. metropolitan districts: 89 percent of districts with Black/ Hispanic student percentages at least 10 points higher than their host metro areas (994 out of 1,116) receive less adequate funding than does their metro area overall. Nationally, a 10 percentage point increase in a district’s Black/ Hispanic student population above its metro area’s overall Black/Hispanic percentage is associated with a decrease in relative funding adequacy of over $1,500 per pupil.
All of our results are descriptive and do not necessarily represent evidence of causality. That said, they do indicate a consistent relationship between racial/ethnic segregation and school funding adequacy both nationally and in our seven focus metro areas. Yet our case studies also show how this unequal opportunity can be traced back to segregative efforts that began over 100 years ago.
Segregation by race and ethnicity—and thus its impact on school finance—didn’t happen by accident.
As a part of our discussion of the segregation/funding relationship in each metro area, we also include an examination of the association between modern school funding adequacy (and demographics) and the “redlining” maps drawn up during the late 1930s. These maps, which were commissioned by the Home Owners’ Loan Corporation (HOLC), assigned A-D grades to neighborhoods across the United States.
The grades ostensibly assessed home lending risk, but they were based in no small part on the race of neighborhoods’ residents. The distribution of grades, therefore, roughly reflects both the segregation situation at the time and general (racialized) risk assessments that directly or indirectly influenced not only HOLC aid but also other federal (e.g., Federal Housing Administration, Veterans Administration) loan insurance decisions going forward (a practice known today as redlining, as the highest-risk areas in the HOLC maps were shaded in red). These programs dramatically increased access to homeownership in the United States, but, due to redlining, the beneficiaries were almost exclusively white.
Within our metro areas, the HOLC redlining maps from 80 years ago consistently correspond with district racial/ethnic composition, school neighborhood poverty, and K-12 funding adequacy today. For example:
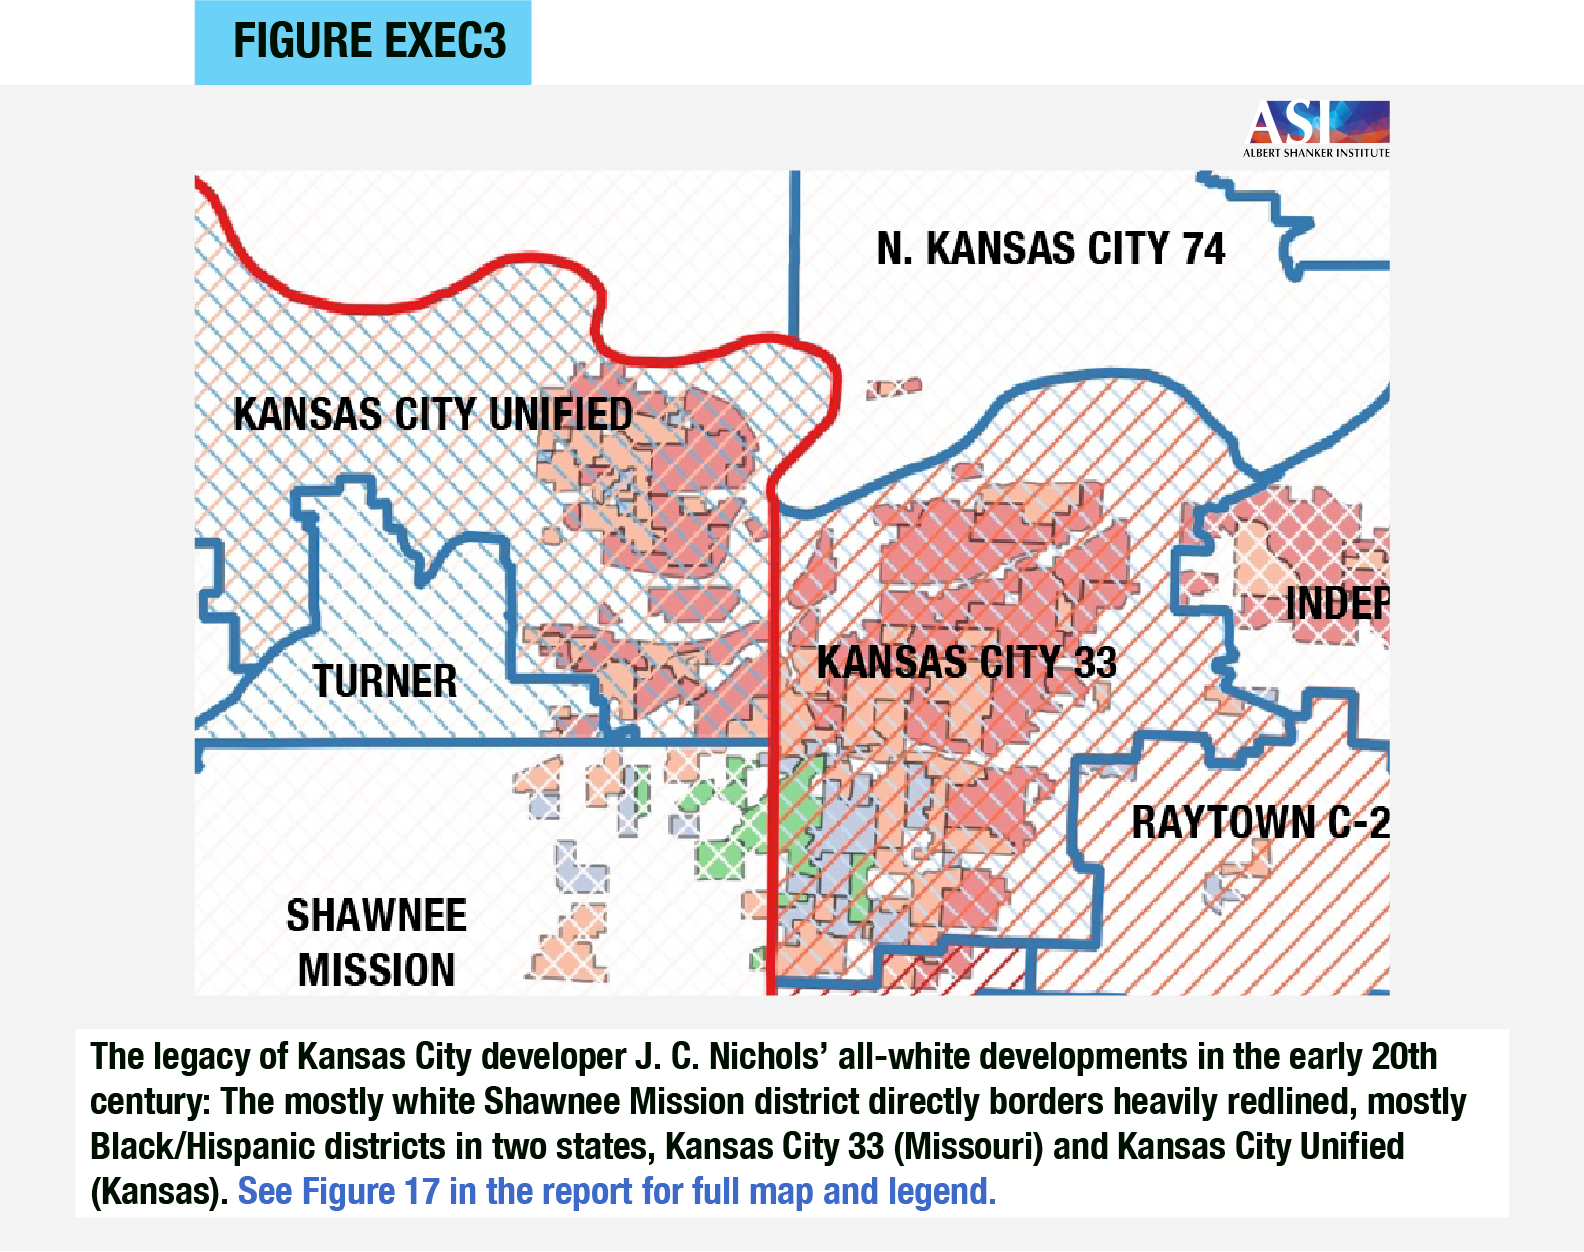
- The vast majority of neighborhoods that received lower (C or D) HOLC grades between 1935-40 are today located in school districts serving larger shares of Black and Hispanic students. (See Figure Exec3.)
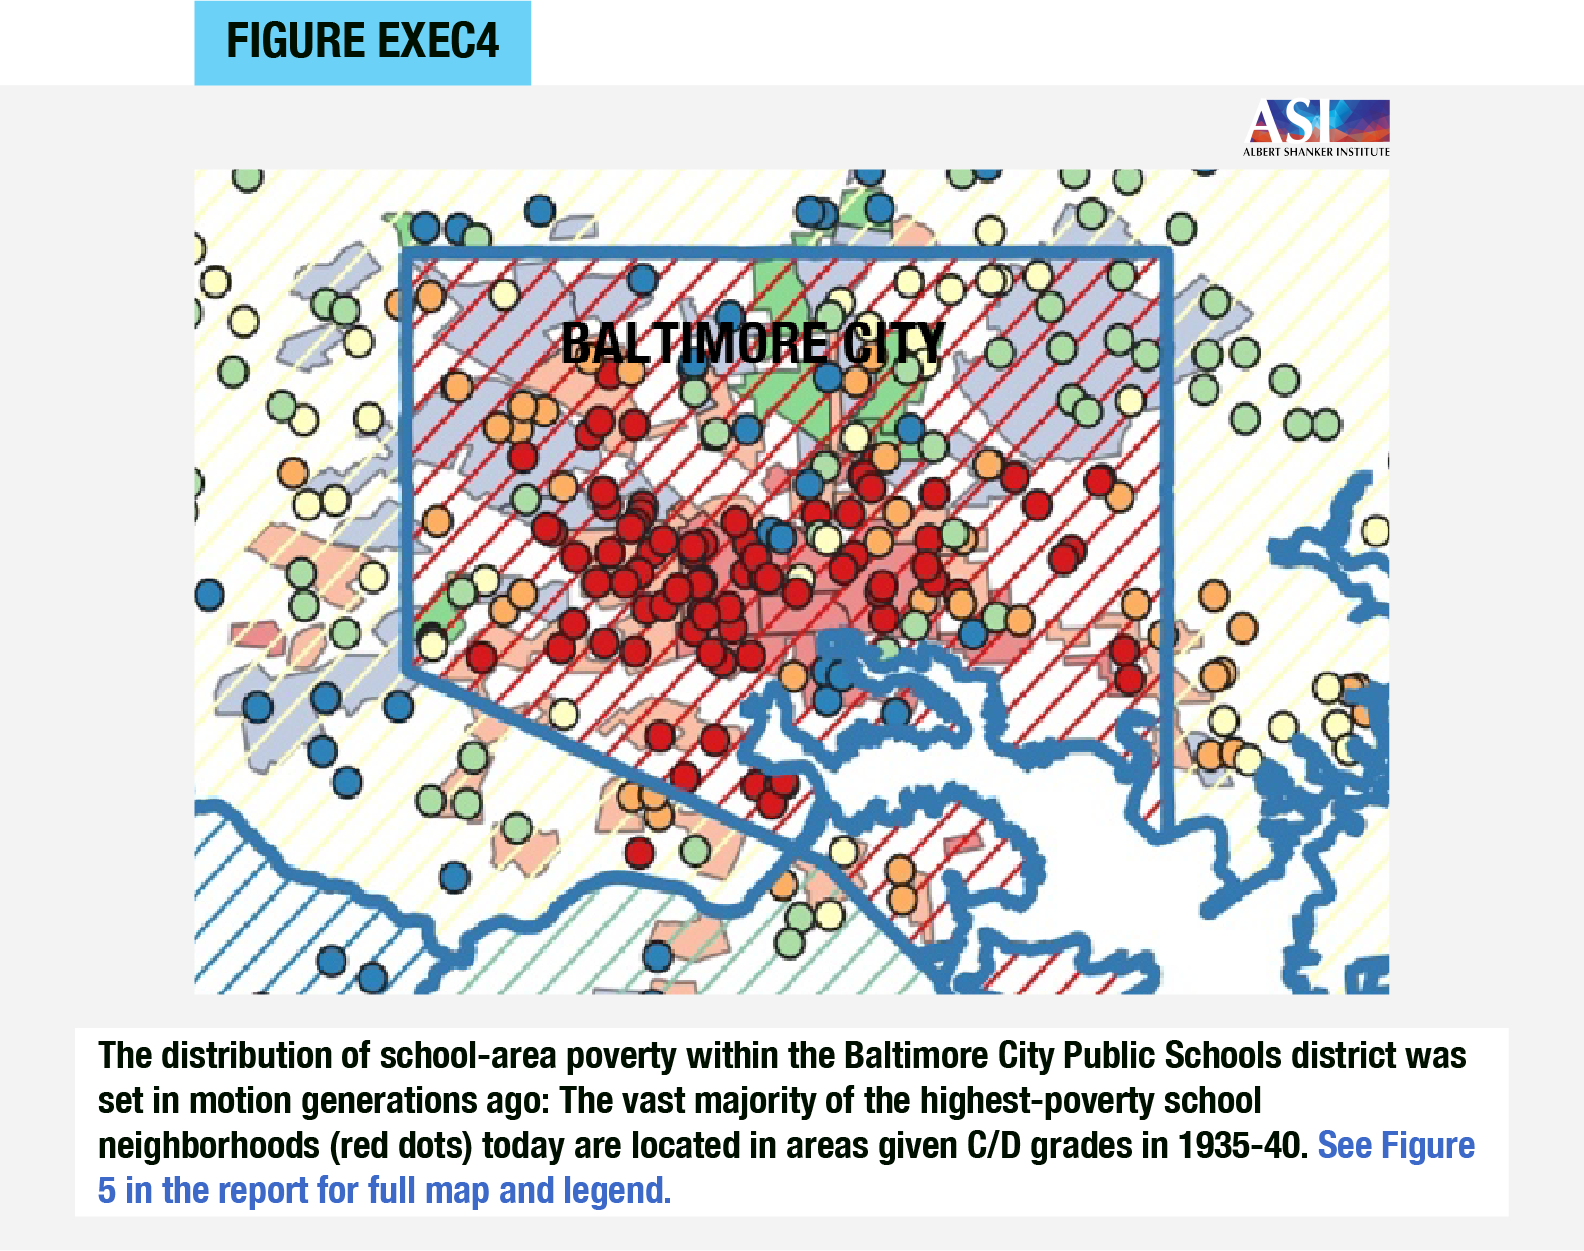
- Schools located in previously C-/D-graded zones are also typically those serving lower-income neighborhoods today. In most of our case study areas, even within districts, a huge proportion of the lowest-income schools are found in C-/Dgraded zones. (See Figure Exec4.)
- Virtually all districts that contain a large area of C-/D-graded HOLC zones are today funded below estimated adequate levels. In a few areas, they are among the only districts in which funding is not adequate.
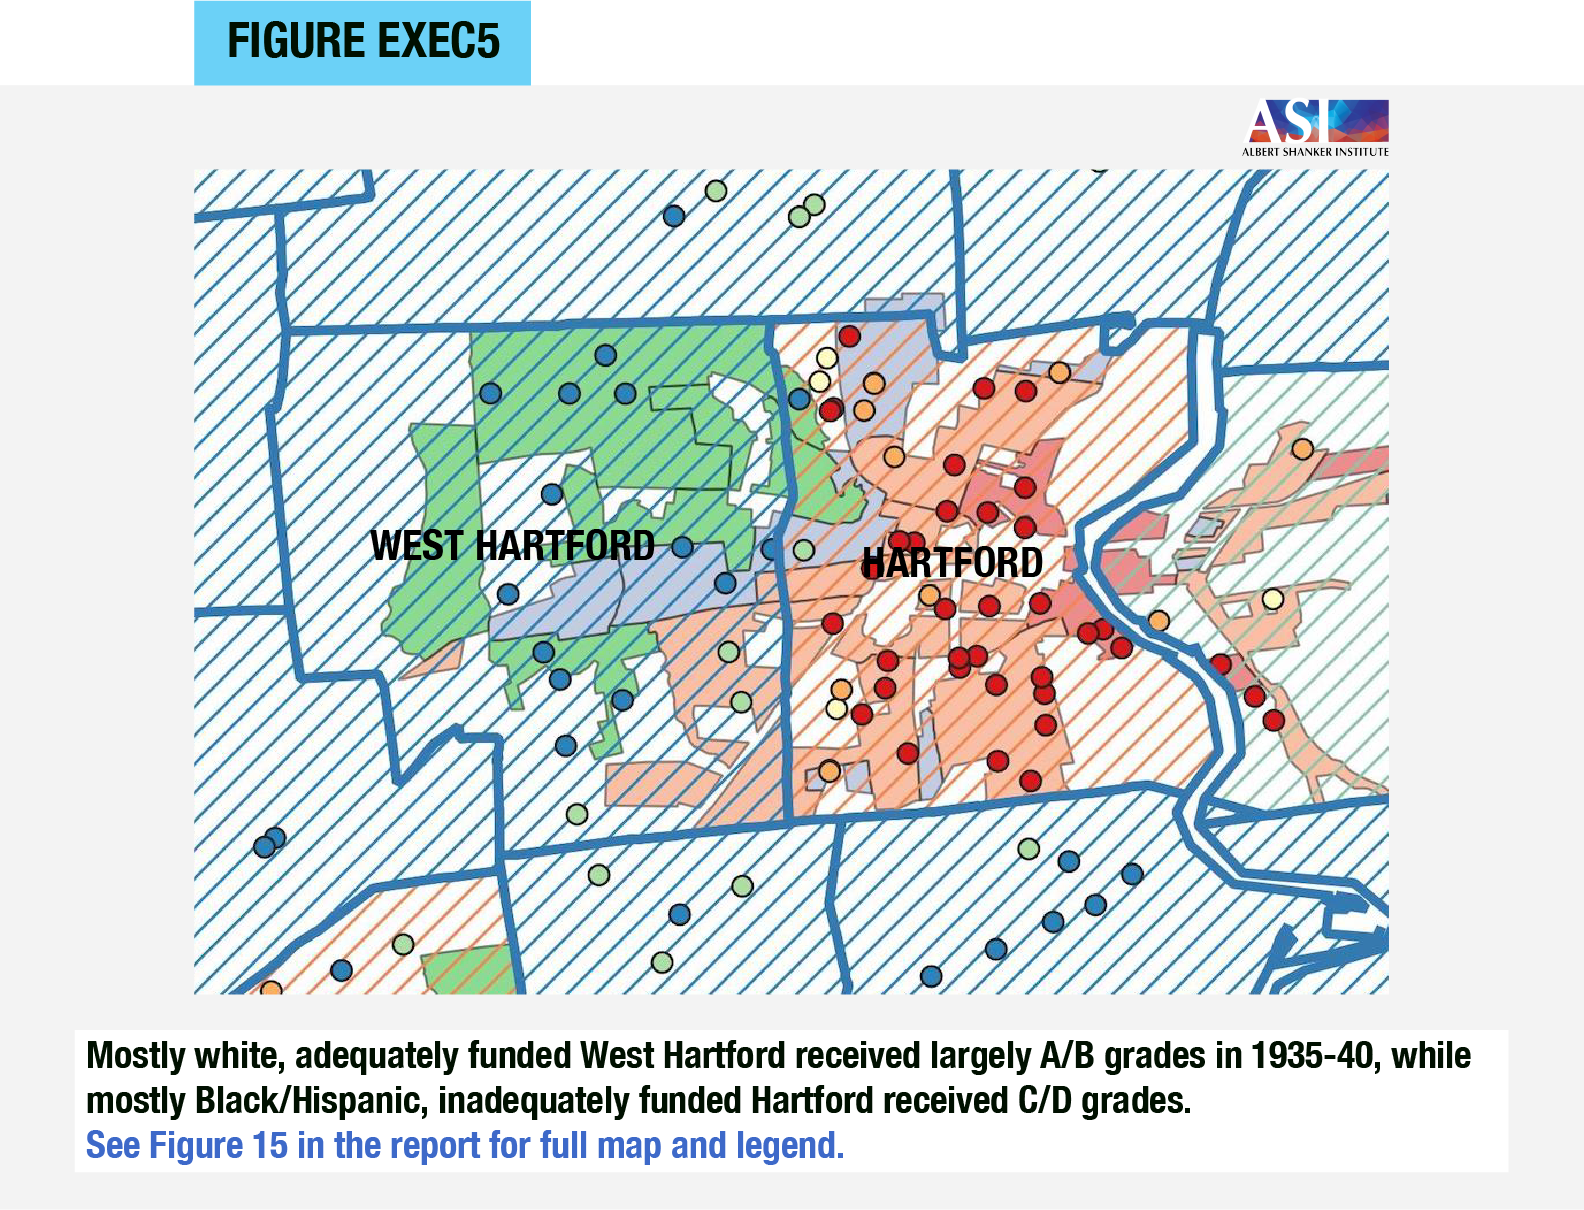
- The districts with large C-/D-graded spaces and inadequate funding are often located right near heavily A-/B-graded districts with adequate funding. (See Figure Exec5.)
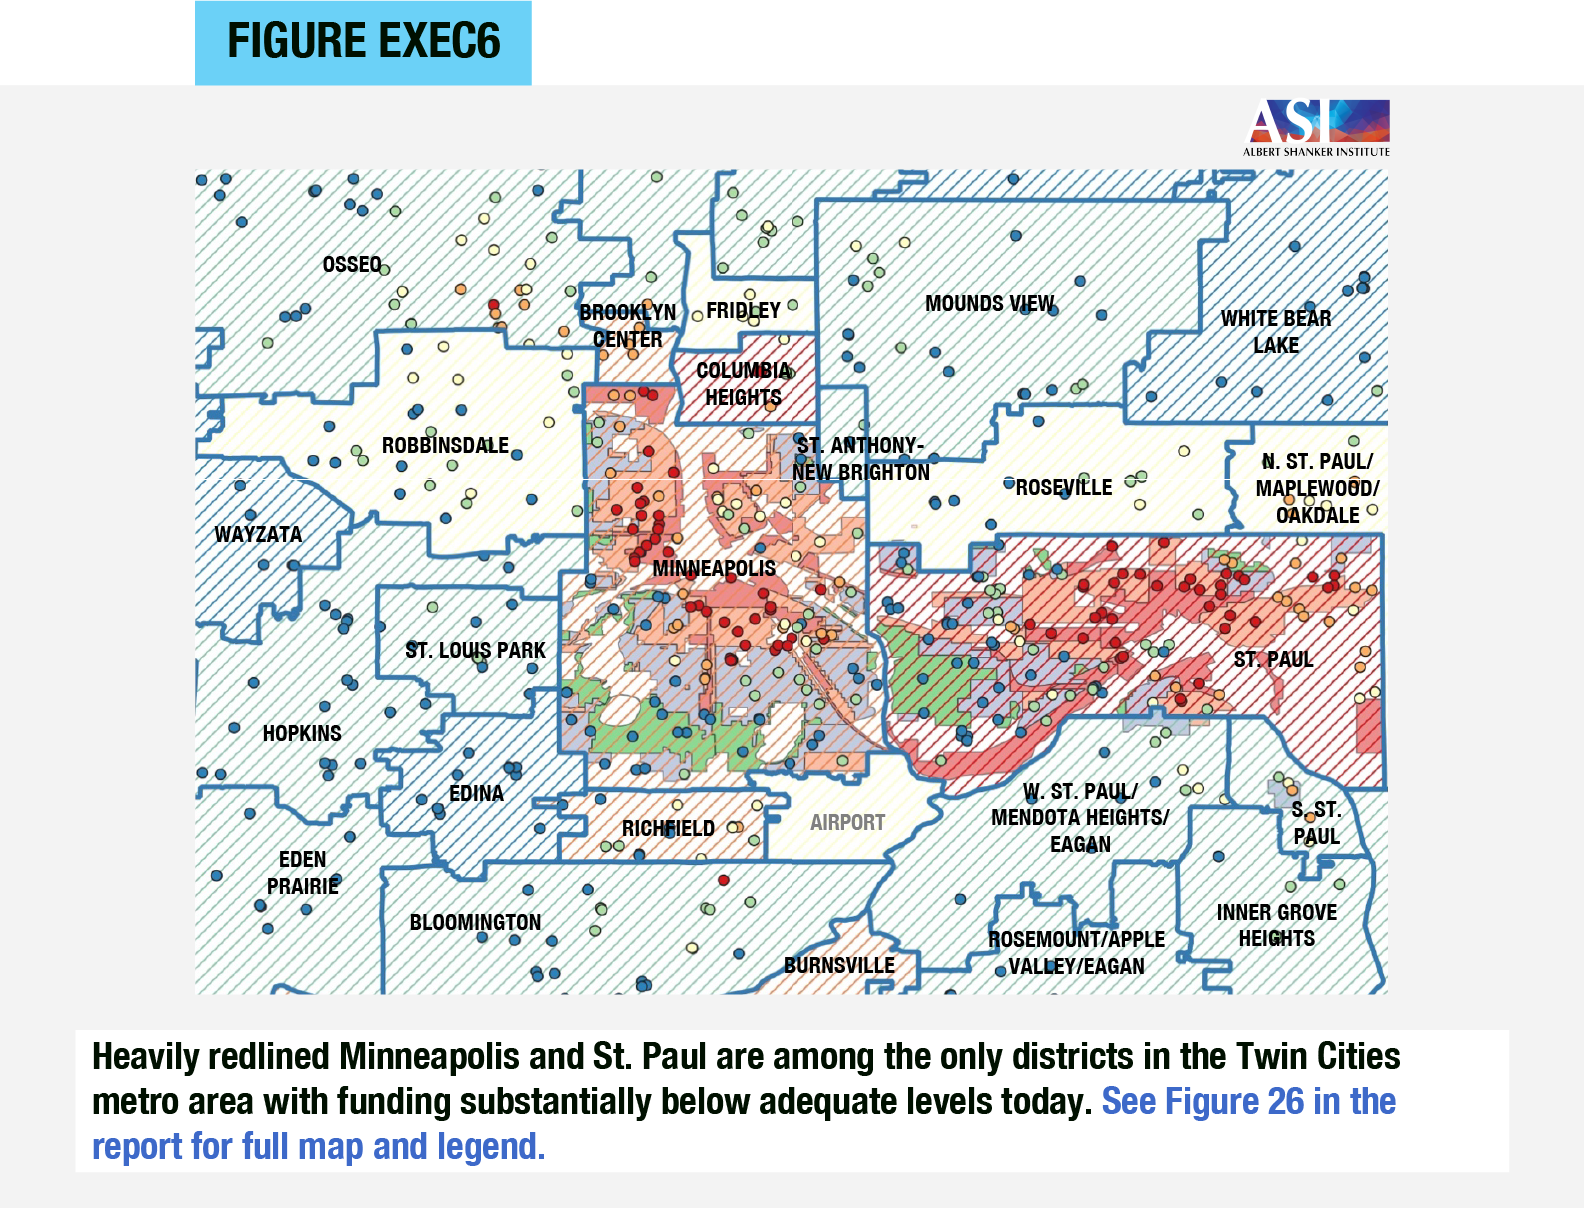
- Funding is usually adequate—or, in a couple of widely underfunded metros, at least less inadequate—in ungraded suburban districts that were in the vicinity of heavily redlined districts but developed later (again, often fueled by federally backed home loans that excluded nonwhite applicants, coupled with private legal agreements never to sell to nonwhite buyers in the future). (See Figure Exec6.)
The case studies in this report also present a great deal of discussion of area-specific features and history. This includes prior evidence of the use of other segregation “strategies” common throughout the 20th century, such as racial covenants, zoning, and blockbusting, which often helps to provide context for—and explain exceptions to—the observations discussed above.
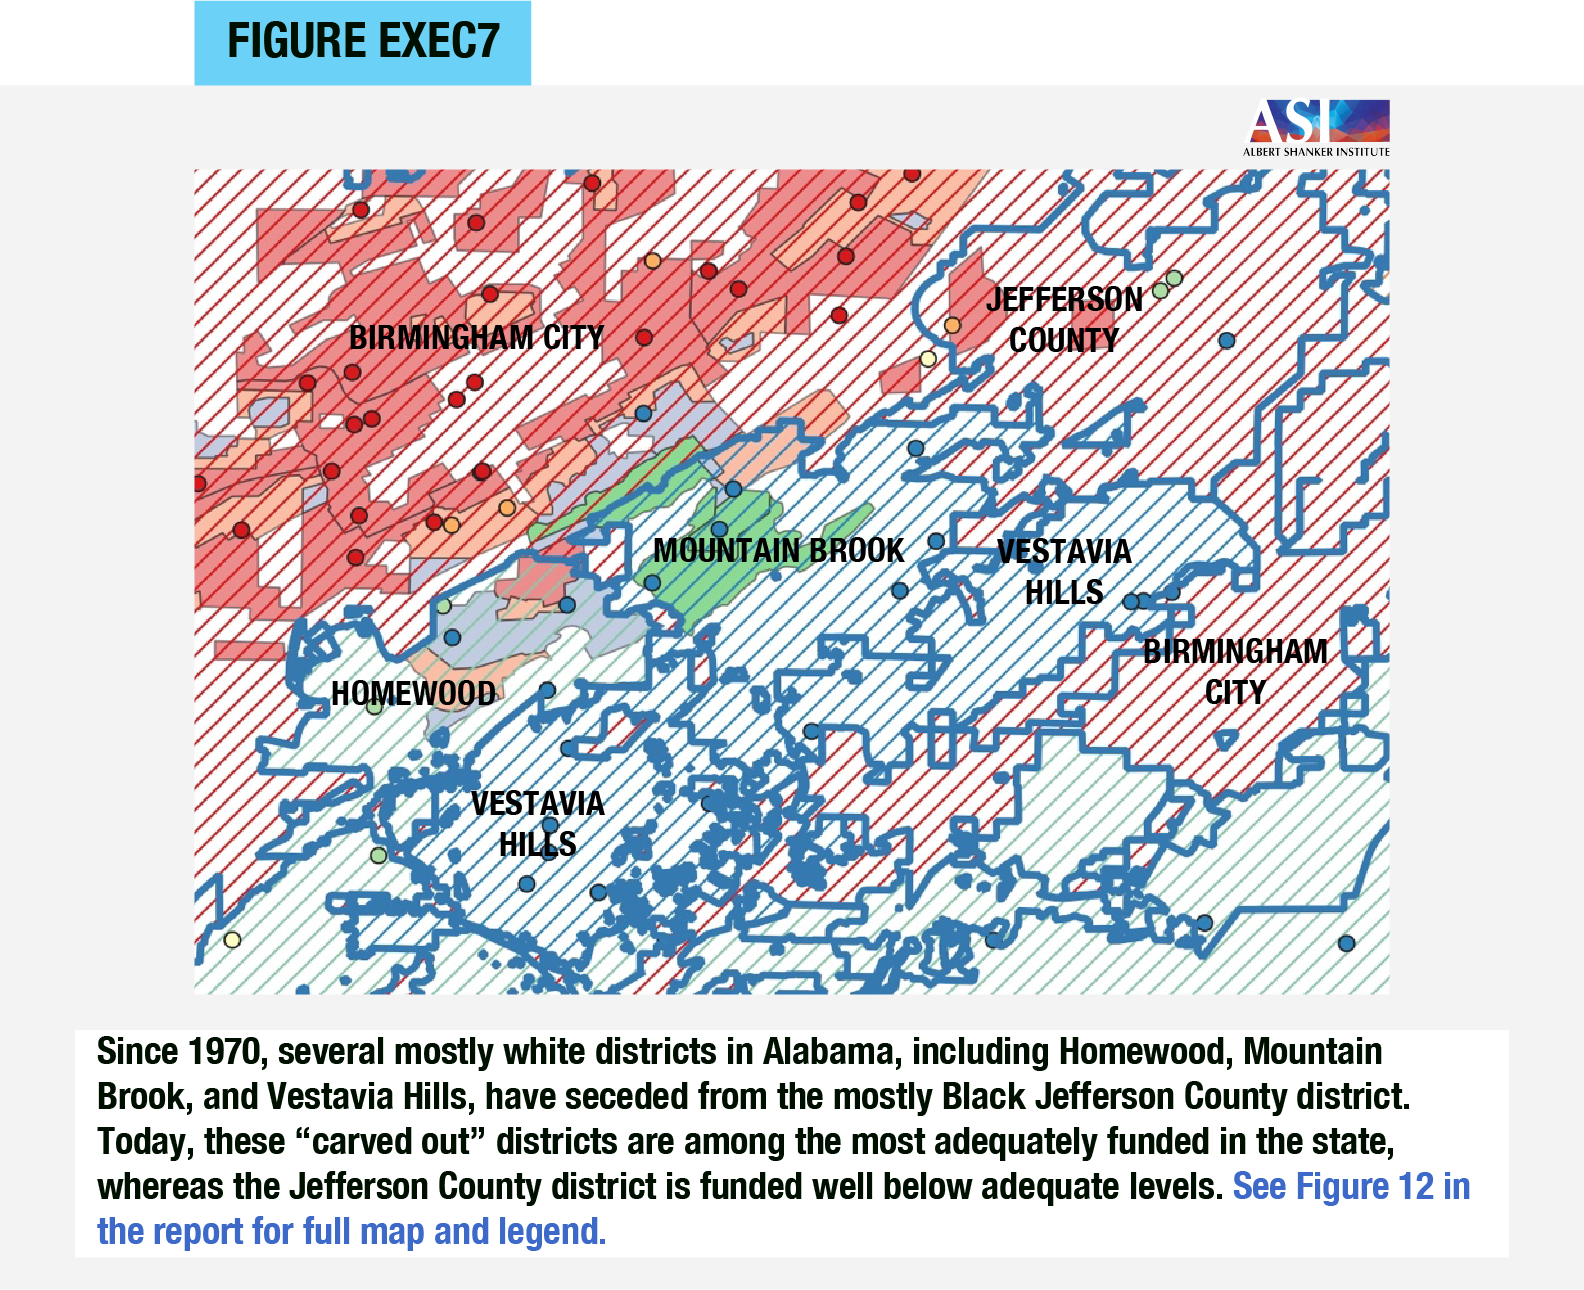
For instance, segregation in the Birmingham metro area has been exacerbated by the secession of several mostly white, relatively affluent districts from their parent Jefferson County district since 1970. (See Figure Exec7.) These secessions, in Alabama and elsewhere, continue even today.
Overall, our seven metro areas vary quite a bit in terms of where they are located, the students they serve, the finance systems of their parent states, and many other aspects. Yet they are all rather consistent in how well they illustrate the relationship between racial/ethnic segregation and school funding disparities. And the national estimates discussed above suggest that they are far from unique in this regard.
This is because racial/ethnic segregation did not occur due to a random confluence of local events and factors. Many of the same basic “tools” were widely employed throughout the United States for over 100 years. The legacy of these efforts for K-12 funding today are clear, and portraying racial/ethnic disparities in funding adequacy and outcomes merely as a side effect of income and wealth segregation requires one to ignore this history. Economic segregation, while interdependent with racial/ethnic segregation today, has its roots in generations of institutional policies and practices to keep people separate based solely on their race or ethnicity. Racial discrimination built the machine, even if economic inequality helps keep it running now.
Footnotes
1 Throughout this summary and report, we will be using the terms “Black” and “Hispanic” instead of “African American” and “Latinx/Latino,” as the former terms are those used by the U.S. Census Bureau and the National Center for Education Statistics, the sources of all our race and ethnicity data. (return to text)
Resources
- Full report (or view in box below)
- Executive summary
- Webinar
- Case study (metro area) sections
Documents