The Wall Chart lives! A collection of education data that was used for state-by-state comparisons, the Wall Chart was one of former U.S. Secretary of Education William Bennett's favorite blunt instruments. It's been revived under the name of the Report Card on American Education by a conservative group known as the American Legislative Exchange Council (ALEC), and ALEC uses the report to draw the same kind of crude and misleading conclusions that the Secretary used to specialize in--and still does.
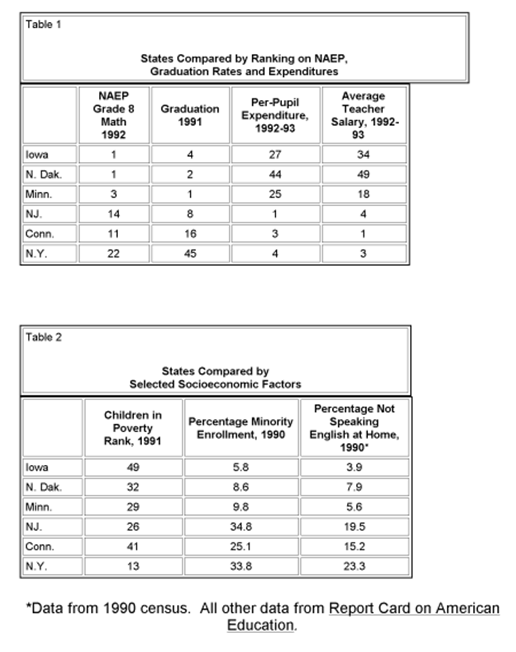
ALEC makes much of the fact that certain states do better on some basic indicators of student success even though they spend much less on education than the average. (See Table 1, below.) Iowa and North Dakota tie for first in the 1992 NAEP eighth grade math scores and are close to the top in the percentage of students they graduate. At the same time, they are very far down in education spending, both in terms of per-pupil expenditures and average teacher salaries. Indeed, North Dakota is practically in the cellar in education spending, while New Jersey, Connecticut and New York, which are high spenders, do more poorly than some states that spend much less.
How can we explain better performance with less money? Emily Feistritzer, the author of the report, mentions "standards" and "academic rigor" and suggests that taking more academic courses (as opposed to soft electives) is related to high achievement. However, most of her data pertain to expenditures and encourage a favorite conservative notion--that spending doesn't count in education.
You can reach this conclusion only by ignoring a lot of things about the kinds of students a state is educating--like how many don't speak English at home and how many live below the poverty line. Youngsters like these cost more to educate, and including these data in comparisons between states changes the picture considerably. (See Table 2, below.) Compare the fact that only 3.9 percent of people in Iowa speak a language other than English at home with New Jersey's 19.5 percent or the 23.3 percent in New York. And compare the far greater percentage of minority children--a disproportionate number of whom are poor--in high-spending states (25 percent in Connecticut and better than one-third in New York and New Jersey) with the 5.8 percent in Iowa.
The point is that some states have bigger challenges to deal with than others. And, in fact, given the problems they face, some states that spend a lot and get unspectacular returns are giving value for their money. The NAEP average in Connecticut is quite respectable--given the minority enrollment and the kids who don't speak English at home. The same is true of the graduation rate in New Jersey.
Suppose a family had to spend extra money helping one of its children succeed in school. If this child still did not achieve as well as the others, would the parents consider the money wasted? Or what about a hospital that dealt primarily with hard cases? It would require more money and would probably have a lower success rate than a hospital that accepted only relatively easy cases, but would anybody automatically assume the first hospital was doing a worse job or squandering its money?
People who say that money is not the answer to every problem in education are right. But it is deliberately misleading not to distinguish between spending in states that have low-need student bodies and states that face the challenge of educating many very needy young people. Numbers don't lie, but liars often make use of numbers.